
Browse articles
- Getting started
- How Monument models finance
- Revenue from resourcing
- Fixed fees
- Budgeting costs
- Recording expenses
- Recording revenue entries
- Going further
- Formula based pricing and construction cost
- Recurring and periodic fees
- Revenue from expenses
- Modifiers: contingencies and discounts
- Progressive billing
- Pricing templates
- Operational expenses
- Control access to business finances
- Control access to rates
- Control who can create projects
- Control project administration
- Control staff and team management
- Control expenses and claims
- Control report definition editing
- Control access to contacts
- Give full project control with Owner
- Manage project work without changing money
- Let project members edit tasks safely
- Share a project safely with Viewer
- Let a team lead coordinate shared work
- Share teammate profiles without management access
- Keep team members focused on their own work
Formula columns
Write a formula that references other columns by name, choose its format, and build a reusable Revenue per Hour column.
What you'll achieve
Turn a figure no ready-made column offers into a real, sortable column, by writing a formula once.
You'll end up with: A reusable Fee per hour column, available from Custom formulas on every Projects report from now on.
Before you start
When the number you need isn't in any menu, write it
Build a custom report covers the Add Column menu's ready-made groups, Calculations and Properties among them, one click each, no formula required. Most questions stop there. Some don't: revenue divided by the hours behind it isn't a field on a project and it isn't a one-click aggregation either, it's a relationship between two columns that already exist. That's exactly what a formula column is for.
A formula references other columns by their visible name in curly braces, something like
{Total Revenue} / {Hours budget}, and the result becomes a real column: sortable, totaling,
and recalculating live, indistinguishable from any other column on the table once it's built.
Name the column before you write the formula
- 1
Open Add Column and choose New Custom Column from the Custom group.
- 2
Name it Revenue per Hour, so the result reads clearly wherever the column ends up being reused.
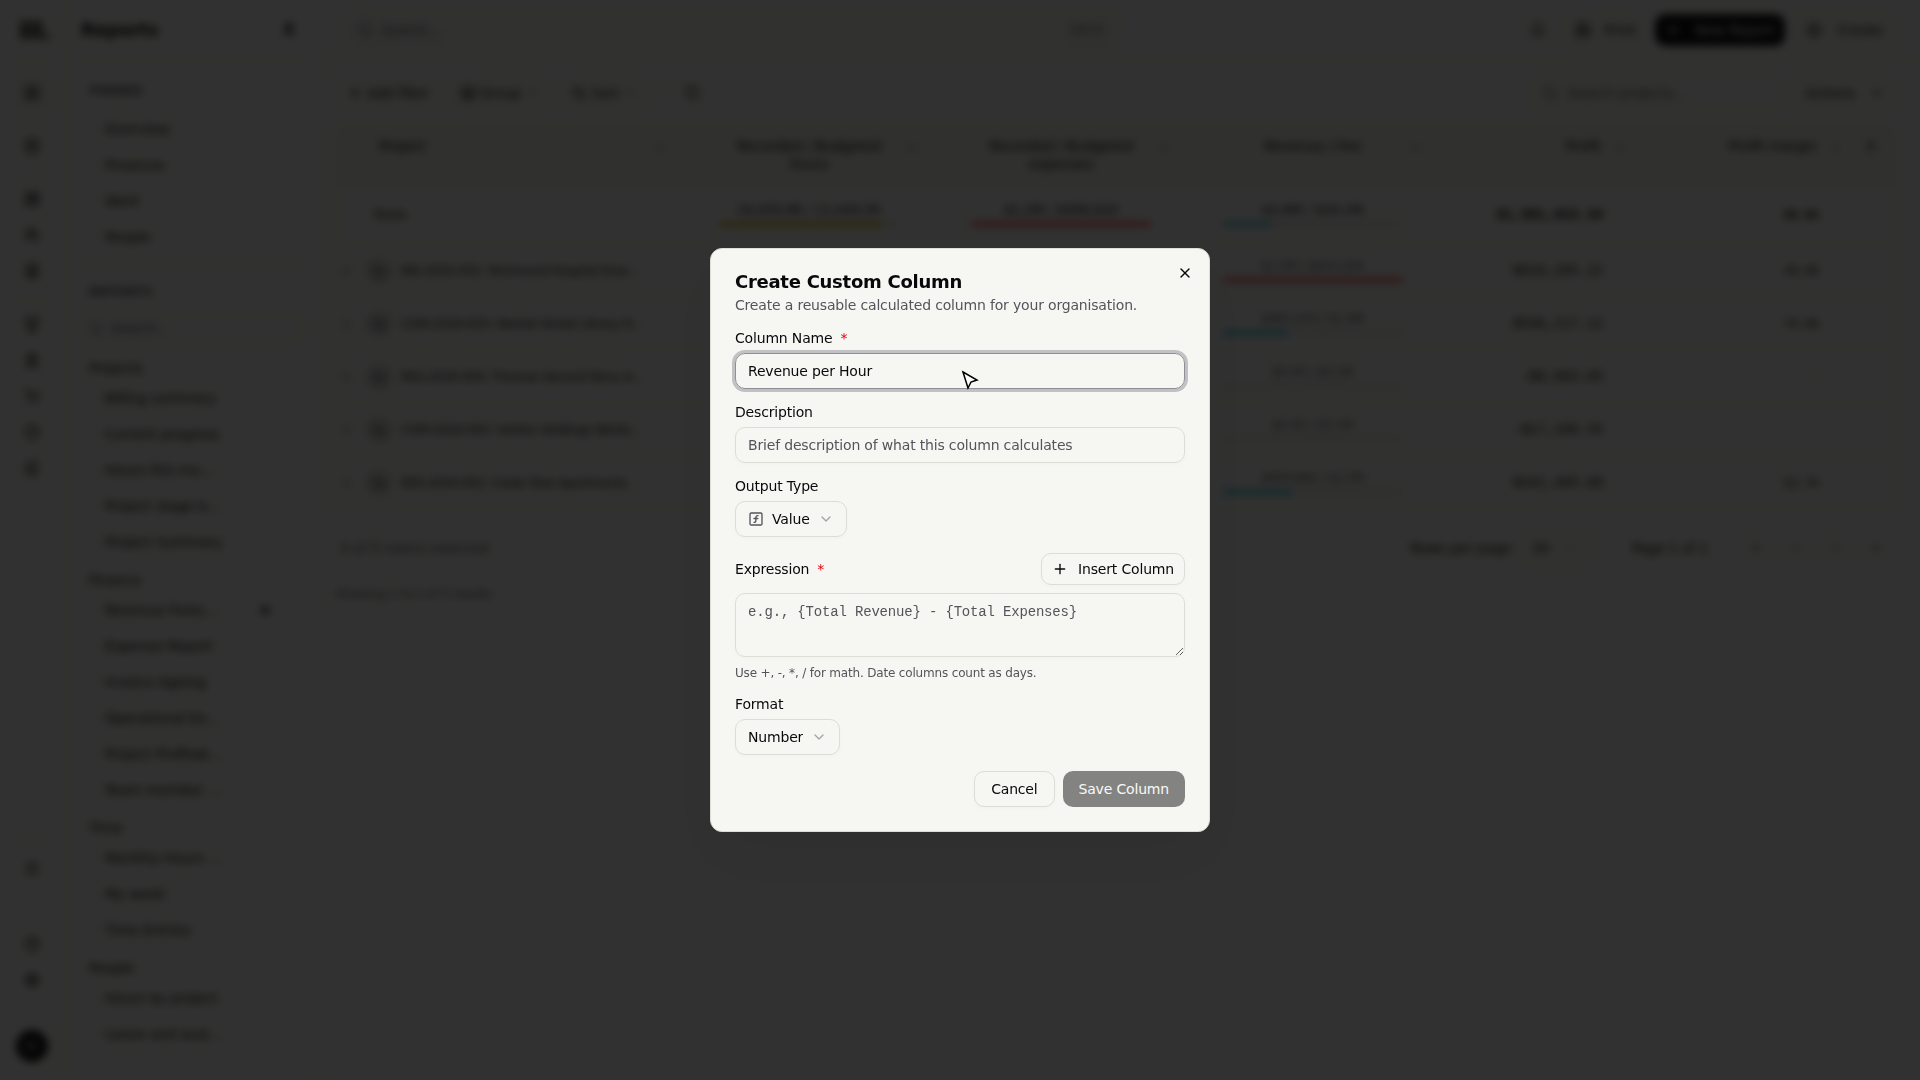
The name isn't just a label. It's also how you'll reference this column from a future formula column, exactly the way you're about to reference Total Revenue in this one.
Insert Column beats typing a reference by hand
- 1
Click Insert Column and choose Total Revenue. The editor writes {Total Revenue} into the expression for you.
- 2
Type / to start dividing, then click Insert Column again and choose Hours budget.
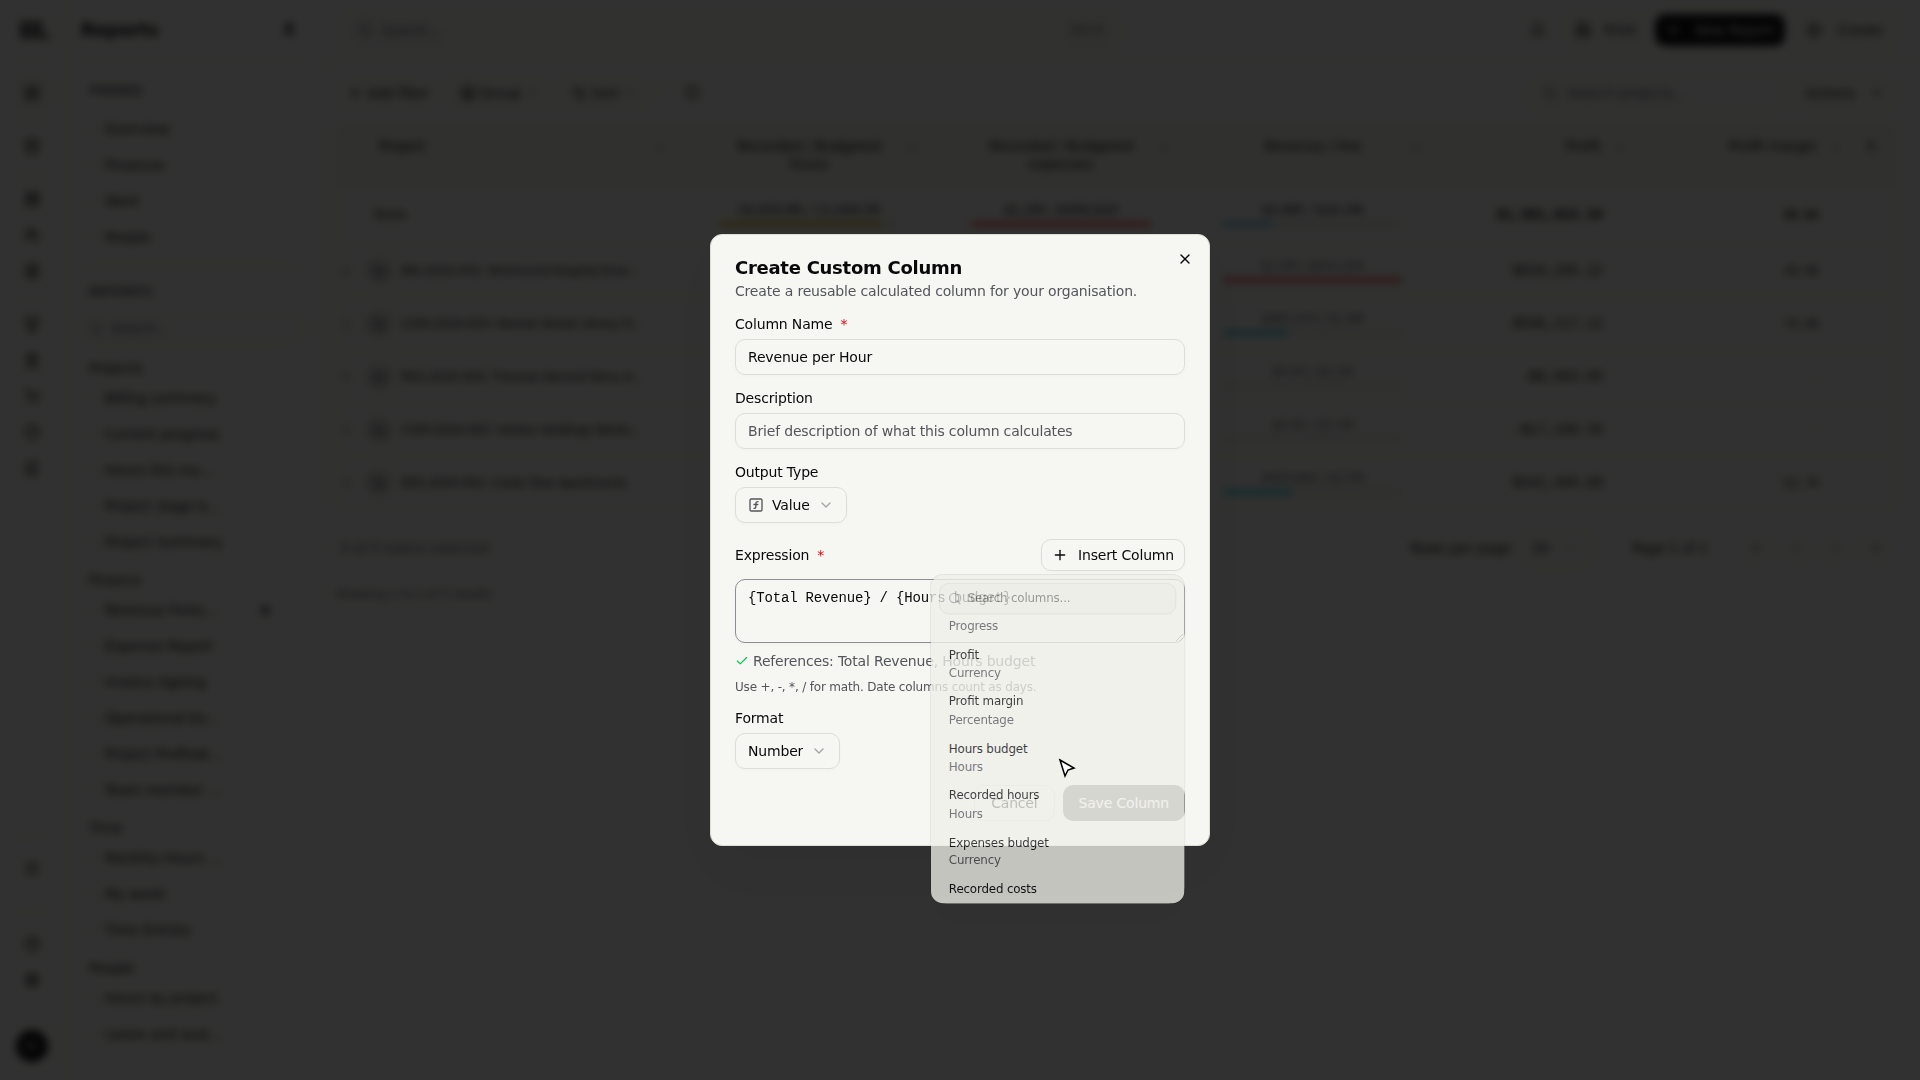
Insert Column exists because a formula only works when a reference matches a column's exact
name, {Total Revenue} has to match Total Revenue exactly, capitalization and spacing
included. Clicking the column instead of typing its name removes that entire class of
mistake, and the editor confirms every reference it recognizes as you build the expression.
A mistyped or unrecognized reference shows a red border and an explanation the moment you type it, not after you've saved and moved on to notice the column looks wrong. Trust that message over guessing; it's checking the exact same names the formula will run against.
Choose how the result displays
Every new value formula starts with Format set to Number. The expression does not change that choice. Keep Number for figures such as Revenue per Hour, or choose Currency, Hours, or Percentage when one of those formats describes the result better. Monument stores the chosen format with the custom column, so the column displays the same way wherever you reuse it.
Choose Percentage when the formula returns a ratio between zero and one. A result of 0.25
displays as 25%. Do not multiply the formula by 100 as well, or the displayed percentage will
be one hundred times too large.
Save it once, reuse it everywhere
- 1
Click Save Column. Monument adds Revenue per Hour to this report immediately.
- 2
The totals row calculates the formula across every matching row in the report, not only the rows visible on the current page.
A formula column isn't trapped inside the report that created it. Once saved, it shows up in the Custom Columns group of the Add Column menu on every report over the same entity, so the studio defines its version of a figure like this exactly once instead of six almost-matching spreadsheets each doing it slightly differently.
You can also subtract one date column from another, {End Date} - {Start Date}, say, and
Monument counts the result in whole calendar days, useful for a duration figure no ready-made
column tracks directly.
Troubleshooting
- "Unknown column" on a reference that looks right. The name has to match exactly, including capitalization and spacing. Delete the manual reference and use Insert Column instead, it can't misspell a name.
- The result uses the wrong units. Edit the custom column and choose Number, Currency, Hours, or Percentage from Format. If you choose Percentage, keep the formula result as a zero-to-one ratio.
- A formula column can't be filtered on. Filters work against a row's actual properties, not a calculated column. Sort by the formula column instead, worst or best first reads the same and needs no filter.
- The column isn't in the Custom Columns group on a different entity's report. A custom column is scoped to the base entity it was built for. Revenue per Hour, built for Projects, won't appear on a Time Entries or Invoices report.
Where this fits next
You can now build the exact figure a question needs, not just the ones already offered. To spread a figure like this across months instead of one column per row, see Time-series columns. To narrow which rows a report like this one includes, see Filter a report.
Related articles
Search Monument help
Search help articles and open a result.