
Browse articles
- Getting started
- Start your first project
- Model your project
- Critical path and automatic dates
- Read and rebalance the swimlanes
- Get oriented on the schedule
- Going further
- Give overhead a home with admin projects
- Structure large projects
- Baselines and versions
- Change Gantt bar colours
- Set a revenue target on the schedule
- Getting started
- How Monument models finance
- Revenue from resourcing
- Fixed fees
- Budgeting costs
- Recording expenses
- Recording revenue entries
- Going further
- Formula based pricing and construction cost
- Recurring and periodic fees
- Revenue from expenses
- Modifiers: contingencies and discounts
- Progressive billing
- Pricing templates
- Operational expenses
- Getting started
- Read your Dashboard
- Build a custom report
- Edit a saved report
- Filter a report
- Formula columns
- Freeze a report into a snapshot
- Reports on a project
- Definitions: how each figure is worked out
- Going further
- Time-Series Columns
- Organise your work with tags
- Break reports and accounting down by office
- Control access to business finances
- Control access to rates
- Control who can create projects
- Control project administration
- Control staff and team management
- Control expenses and claims
- Control report definition editing
- Control access to contacts
- Give full project control with Owner
- Manage project work without changing money
- Let project members edit tasks safely
- Share a project safely with Viewer
- Let a team lead coordinate shared work
- Share teammate profiles without management access
- Keep team members focused on their own work
Build a custom report
Answer a real business question with a saved table: pick an entity, add calculation columns, invent your own with formulas, group for subtotals, and sort, then save it so the answer is one click away next time.
What you'll achieve
Turn a business question into a saved, reusable table grouped and sorted exactly how you need it.
You'll end up with: A saved Project Margins report with an expenses column added, grouped by status with subtotals and sorted by margin.
The dashboard answers a general question, a report answers your question
The dashboard tells you the firm's health in broad strokes. What it can't do is tell you which specific projects are actually making money and what stage they're at, that's a narrower question, and it needs a table built to answer exactly it. The good news is that every report in Monument, no matter how specific the question, is built from the same five decisions in the same order. Learn that shape once and you can build any report there is.
Every principal at Meridian Studio eventually asks how are the commissions actually performing. This tutorial builds the answer as a Project Margins report, revenue against expenses, grouped by status, worst margins surfaced first, then saves it so nobody has to rebuild it next month.
Five decisions, made in order, every single time
- Entity: what are the rows? Projects, invoices, time entries, expenses, contacts. This is the first and biggest choice, because it decides what one row of the table even means.
- Columns: what do you want to see about each row? A new report starts with sensible columns already in place, you add what your question needs and hide the rest.
- Filters: which rows actually belong? Narrow by a row's properties, status, client, dates, total revenue, total hours. A date filter can stay live instead of freezing, Last 30 Days keeps meaning the last 30 days forever, see Dynamic dates that never go stale.
- Grouping: how should rows bundle together? Grouping collapses rows into bands and gives each one a subtotal, arguably the single most useful thing a report does.
- Sort: what order matters? So the rows you actually care about sit at the top instead of buried in the middle.
Nail these five and the table answers the question by itself. Everything past this point is refinement.
Every report starts as an ad-hoc, unsaved working table, build it, tweak it, throw it away, no commitment required. Only once it earns its place do you save it into a named report the whole studio can reopen. Same builder either way, just two different lifespans: a scratch table for a one-off question, a saved report for one you'll keep asking.
Pick the entity first, because it decides everything downstream
Choosing the entity happens before the builder even opens: the reports list is organized into one tab per entity, and the New button on each tab already knows what it's about to create.
- 1
On the reports list, click the Projects tab so each row you're about to build with is one project.
- 2
Click New Project Report. Each row is now one of Meridian Studio's commissions, Cedar Row Apartments among them, with Profit and Margin already showing.

A projects report doesn't actually open empty. Profit, revenue minus cost, and Margin, profit as a percentage of revenue, are template columns that show up automatically the moment you start one from the Projects tab. You're not adding them, they're simply the starting point Monument assumes you'll want.
Profit tells you the dollar amount; margin tells you whether that amount is actually healthy. A project can post a solidly positive profit and still be a bad job if its margin sits far below what your studio targets, a big project with a thin margin can look better on the profit line than it deserves to.
The Add Column menu is really four different kinds of number
Our question wants spending made explicit, so add a Total Expenses column. The menu it comes from is organized into four groups, and understanding them is understanding what a report can show at all:
- Calculations: ready-made aggregations over the entity's own data, Total Expenses among them. One click, no formula required.
- Time Series: a figure spread across periods, one column per month, quarter, or year, its own topic entirely: see Time-series columns and exporting.
- Properties: the entity's plain fields, status, client, dates.
- Custom Columns: formula columns anyone in the studio has already created.
- 1
Open the Add Column menu and pick Total Expenses from the Calculations group.
- 2
The table now reads project, status, revenue, expenses, profit, margin, everything this question needs sitting on one row.
When the number you need isn't in any menu, write it
New Custom Column lets you build a formula that references other columns by name in curly braces, something like {Total Revenue} - {Total Expenses}, and the result becomes a real column: sortable and recalculating live like the other calculated columns on the table.
The editor is built to keep you from guessing wrong. Live validation flags a mistyped column reference the moment you type it, not after you've saved and moved on. Format inference figures out that dividing a currency by a currency should probably be a percentage, without you telling it so. A Progress output type turns a numerator-and-denominator formula into an actual progress bar per row, ideal for something like how much of the budget is spent. And because a custom column isn't trapped in the report that created it, once built it shows up in the Custom Columns group for every report on that entity, so the studio defines its version of margin exactly once instead of arguing about six almost-matching spreadsheets.
Template columns answer the questions everyone asks. Custom columns answer the question that's specific to how your firm actually measures a job, fee net of subconsultants, spend against approved budget shown as a bar, whatever it is. Build it once as a column and it's available to drop into any report from then on.
Grouping is where the story actually shows up
A flat list of projects is useful. A grouped one tells you something. Group by Status and the report bundles projects into bands, on hold, in progress, complete, and gives each band its own subtotal, so you can see immediately whether the thin margins are concentrated somewhere you can still fix them (in progress) or already locked in (complete).
- 1
Group the report by the Status column.
- 2
Read the subtotal on each status band: revenue, expenses, and profit now add up per group, not just per project.
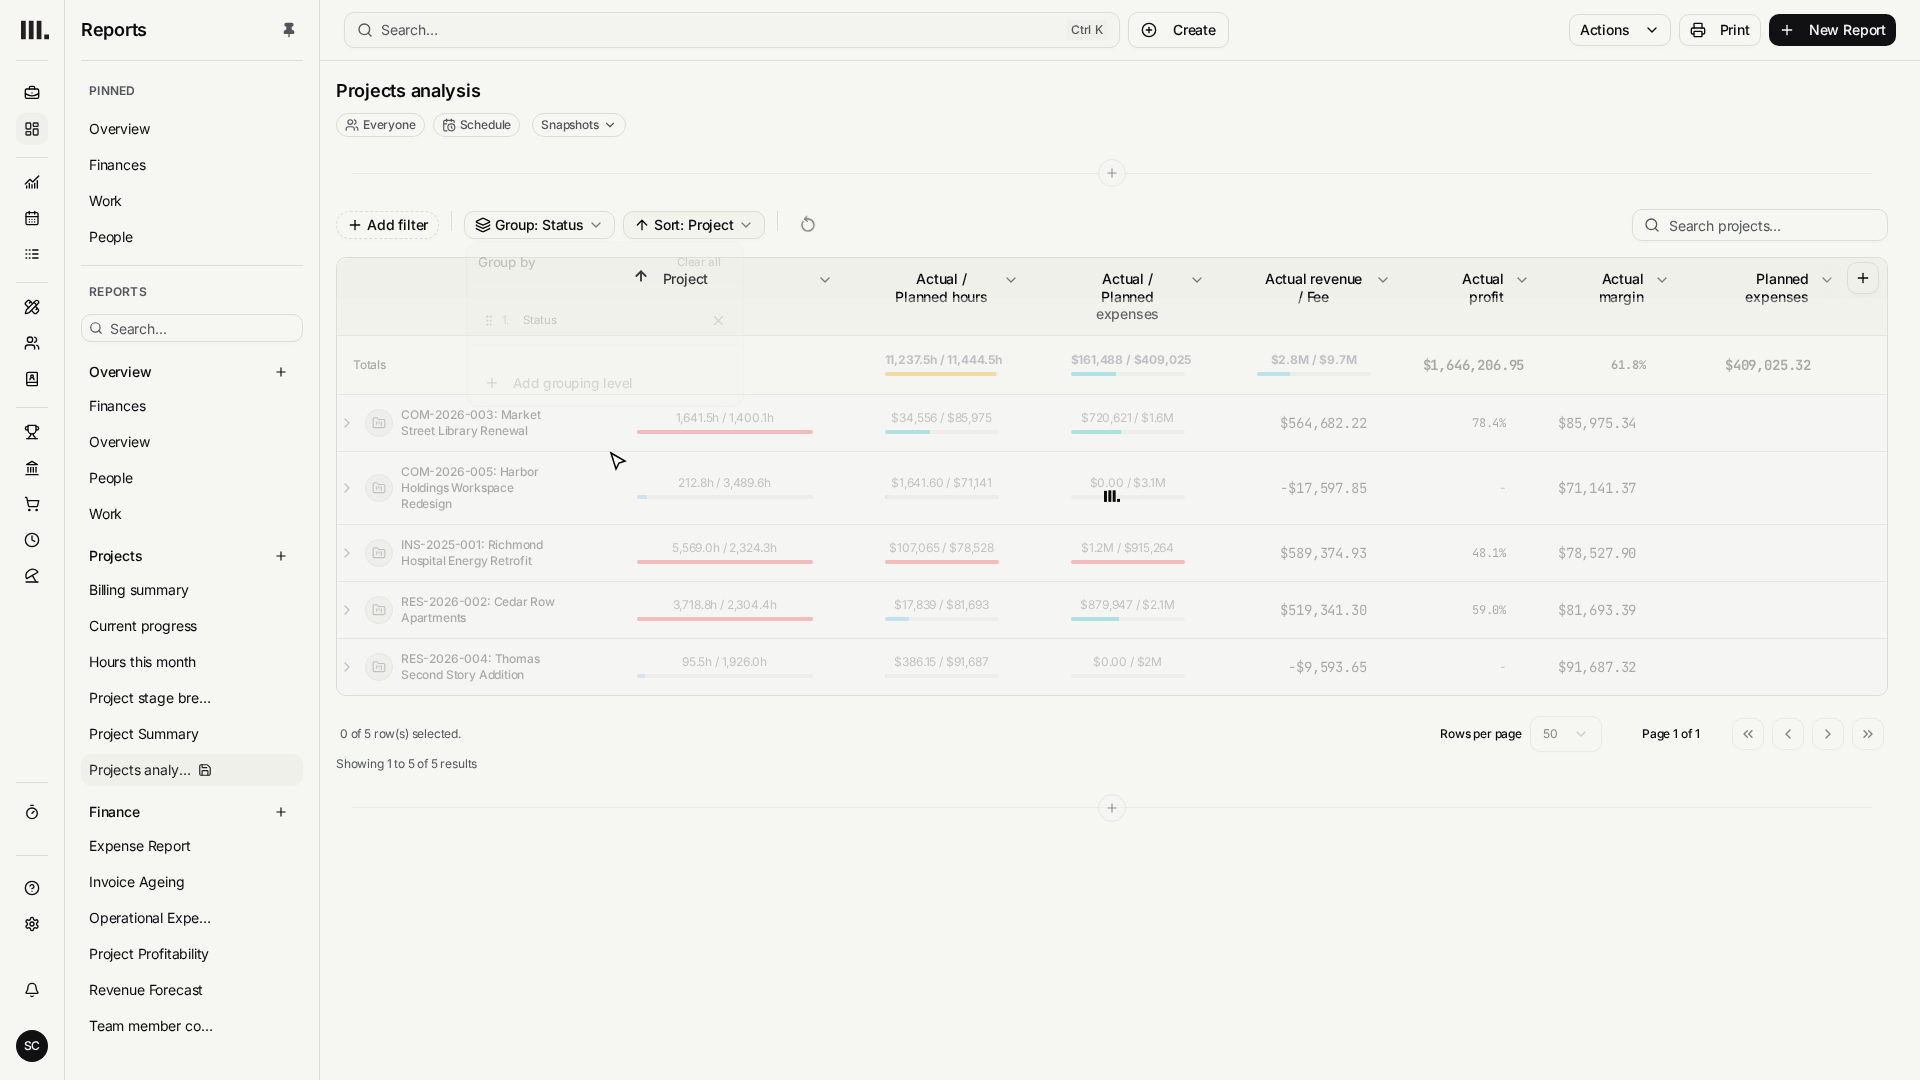
The subtotal per band is the actual payoff of grouping. A spreadsheet makes you write those sums and hope you update them correctly as data changes; a grouped report just keeps them correct. Group by status today, regroup by client tomorrow, same underlying data, a completely different question answered, and nothing to rewrite.
Sort, then save it so the answer sticks around
- 1
Sort by Margin so the tightest jobs lead each group.
- 2
Save the report as Project Margins, choosing Organization visibility so the whole studio shares it.
- 3
It's now a tab on the reports screen. Set it as the default for projects if it's the view you want first, and it recalculates against live data every time it opens.
Saving surfaces one decision worth pausing on: Visibility. Organization turns the report into a shared tab everyone in the studio can see; Private keeps it just yours. Either way, a saved report becomes a tab across the top of the reports area, and you can mark any one as the default for its entity, the view that opens first whenever anyone looks at projects.
A report can grow into more than one block
Everything so far builds one table. A report doesn't have to stop there: add a chart or a stat tile next to it and the report becomes a small ordered stack of blocks instead of a single table, each block still built from the same five decisions, just with its own entity, columns, and filters.
- 1
From the report's Actions menu, click Add chart for a quick chart alongside the current table, or open Add block and choose Table, Chart, or Stat to add one explicitly.
- 2
The report converts from one table into a small stack of blocks: the original table becomes the first block, and the new one appears below it.
- 3
Click Add block again to keep stacking blocks: a stat tile summarizing this month's totals, a chart trending them, a second table drilling into the detail behind either one.
Every block picks its own entity independently, so a report isn't locked to Projects just because its first block is. A stat tile pulling hours from time entries can sit right above a table listing invoices, one saved report answering a question that used to need two or three separate ones.
A brand-new report always starts as the classic single-table shape this whole article teaches. Blocks are something you add on top once one table alone stops answering the question, not something every report has to build up front.
When a block says "Unavailable"
Blocks respect the same permissions as everything else in Monument. If you save a report with a financial stat tile and share it with someone who can't see financial data, they still see the report, they just see that block replaced with Unavailable in the exact spot it would otherwise sit. The rest of the report renders normally around it, nothing shifts to fill the gap, and there's no way to peek at what an Unavailable block would have shown.
Troubleshooting
- The entity decides everything downstream, so get it right first. You can't add a column the entity doesn't have. If a figure you want isn't offered anywhere in the menu, you likely picked the wrong rows, time entries instead of projects, say.
- Don't go hunting the Add Column menu for Profit and Margin. On a projects report they're already template columns sitting in the table the moment it opens. The menu is only for what isn't there yet.
- A formula column can't be filtered on. Filters work against a project's actual properties, status, client, dates, total revenue, total hours, never against a calculated column like Margin. To surface the loss-makers instead, sort by Margin, worst-first reads the same and needs no filter at all.
- A custom formula references columns by exact name.
{Total Revenue}has to match the column it's pointing at exactly; trust the live validation message and red field border the instant it appears rather than saving first and debugging later. - A saved report is the question, not a snapshot of an answer. Reopen it next month and it re-runs against whatever the current numbers are, so last month's profitability report will show this month's figures. That's the point, not a bug to work around.
- When a report is grouped, read the subtotals, not the individual rows. The band subtotal is the headline number; scanning row by row misses the story the grouping was built to tell.
Where this fits next
You can now answer a point-in-time question about the whole portfolio. To narrow this report's rows instead of rebuilding it, see Filter a report; to change its columns after saving, see Edit a report. To watch a number actually move over time instead, revenue spread across months, quarters, or years, see Time-series columns. To understand where Profit and Margin actually come from underneath all this, read the financial model overview.
Search Monument help
Search help articles and open a result.