
Browse articles
- Getting started
- How Monument models finance
- Revenue from resourcing
- Fixed fees
- Budgeting costs
- Recording expenses
- Recording revenue entries
- Going further
- Formula based pricing and construction cost
- Recurring and periodic fees
- Revenue from expenses
- Modifiers: contingencies and discounts
- Progressive billing
- Pricing templates
- Operational expenses
- Control access to business finances
- Control access to rates
- Control who can create projects
- Control project administration
- Control staff and team management
- Control expenses and claims
- Control report definition editing
- Control access to contacts
- Give full project control with Owner
- Manage project work without changing money
- Let project members edit tasks safely
- Share a project safely with Viewer
- Let a team lead coordinate shared work
- Share teammate profiles without management access
- Keep team members focused on their own work
Filter a report
Narrow a report live with option-list, numeric, and date-range filters, stack several at once, and keep every one of them editable and removable.
What you'll achieve
Narrow a report to the rows that actually matter, live, using status, numeric, and date filters together.
You'll end up with: A Projects report narrowed live by status, revenue, and a current date window, with every filter chip still editable and removable.
Before you start
A filter narrows which rows show up; nothing else about the report changes
Build a custom report is where filters were flagged as the third of the five decisions: which rows actually belong. Everything about columns, grouping, and sort still works exactly the same on a filtered report, filtering only changes which rows those other decisions apply to. Add Total Revenue greater than zero, and the report is still grouped by Status and sorted by Margin on whatever's left, just on a narrower set of projects.
Every field type gets a filter shaped for what it actually is: a checkbox list for a status or another fixed set of options, a number and a condition for anything numeric, and the same date-range control used everywhere else in Monument for a date. You don't learn a new interaction for each field, you learn the shape once per data type.
An option list narrows by matching any of your picks
- 1
Click Add filter and choose Status. It opens as a checkbox list, not a single dropdown, because you often want more than one stage at once.
- 2
Tick In Progress, and the table narrows live to just those projects.

- 3
Tick Not Started as well. Both stay selected and the rows update again, an option-list filter matches any ticked value, not only the last one you picked.
Status behaves like an "or", not an "and": ticking both In Progress and Not Started shows projects at either stage, not only ones that are somehow both. Each additional tick widens what qualifies, it's the filter itself, Status equals one of these, that narrows the whole report.
A number filter pairs a condition with a value
- 1
Click Add filter again and choose Total Revenue. Its panel keeps a condition and a number together in one place.
- 2
The condition starts at greater than. Enter zero, and the report narrows to projects that have posted any revenue at all.
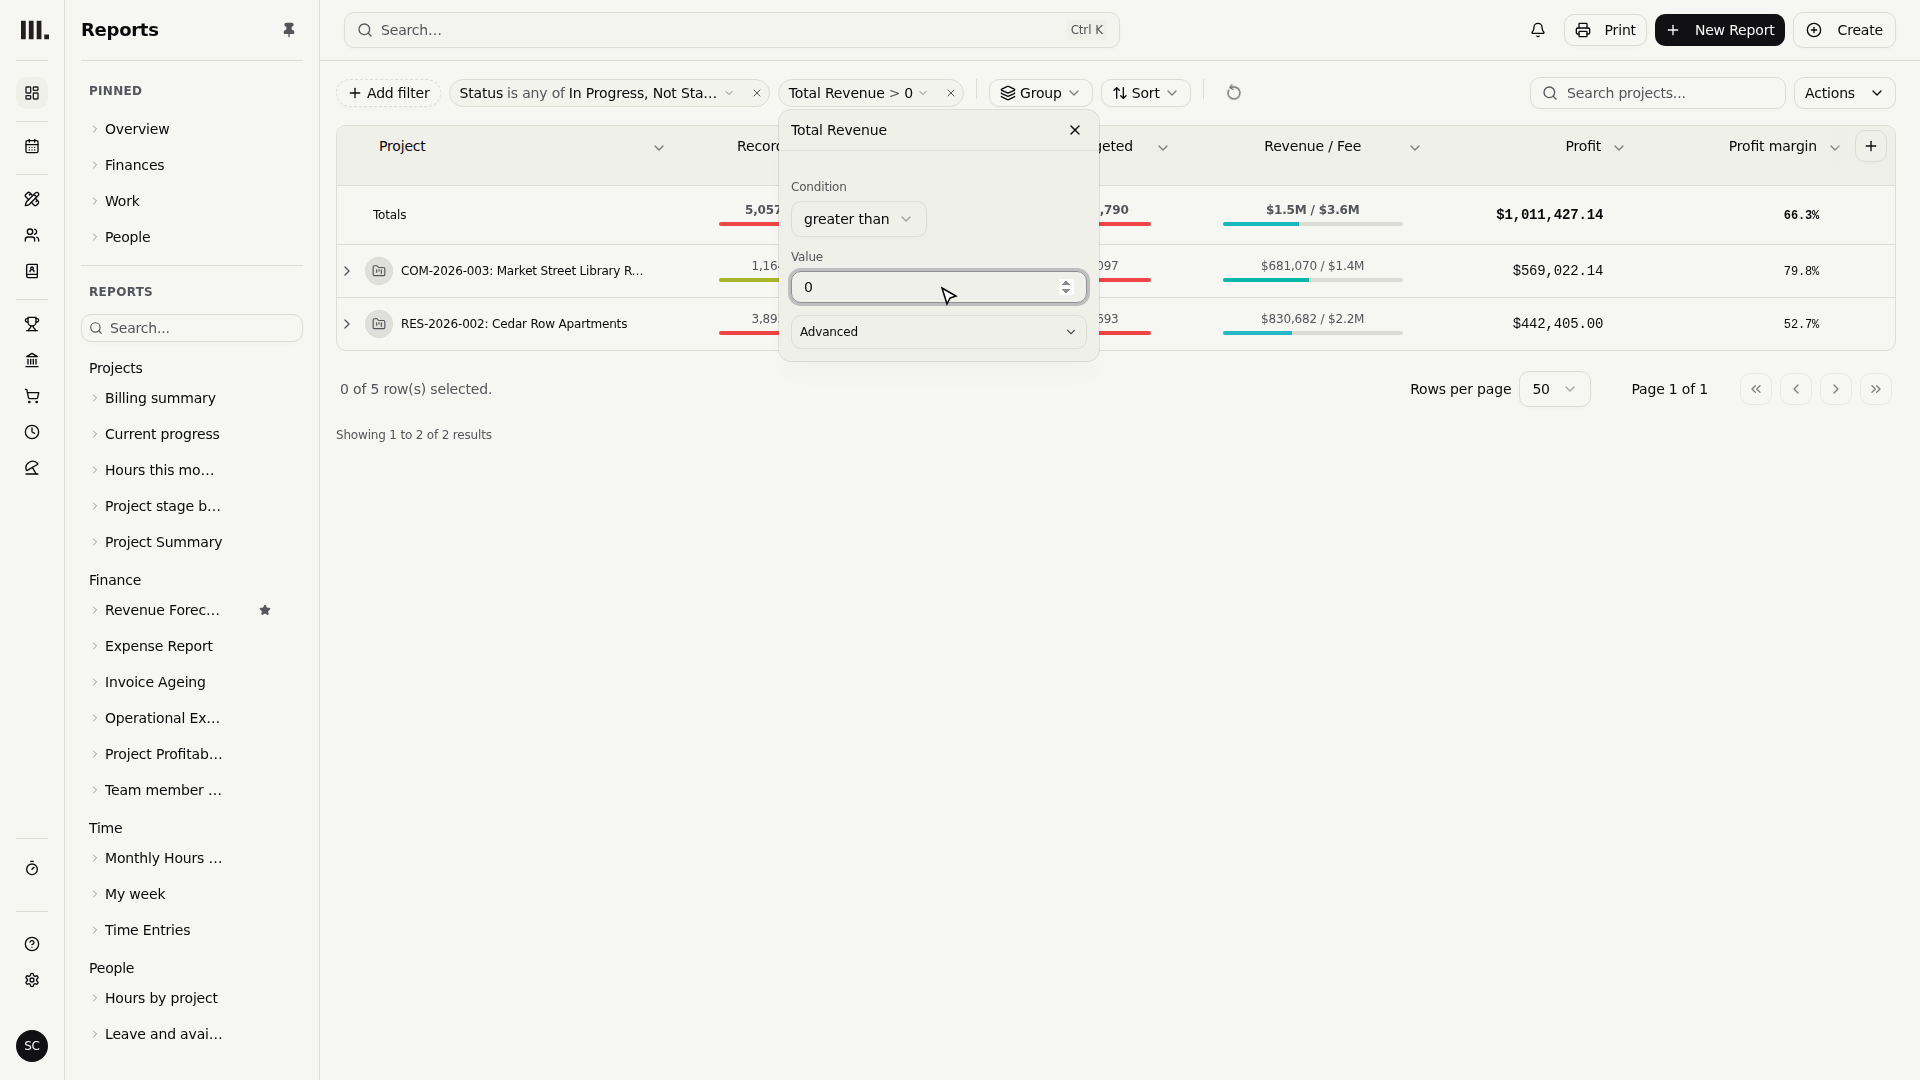
Total Revenue greater than zero is a small, deliberate example, but the same panel works for a real threshold too: greater than a target figure to find the projects actually worth reviewing, or less than one to catch the ones falling short.
A date filter uses the one date-range control, everywhere
- 1
Click Add filter once more and choose Start Date. Every date filter throughout Monument, report filters included, opens the same date-range control.
- 2
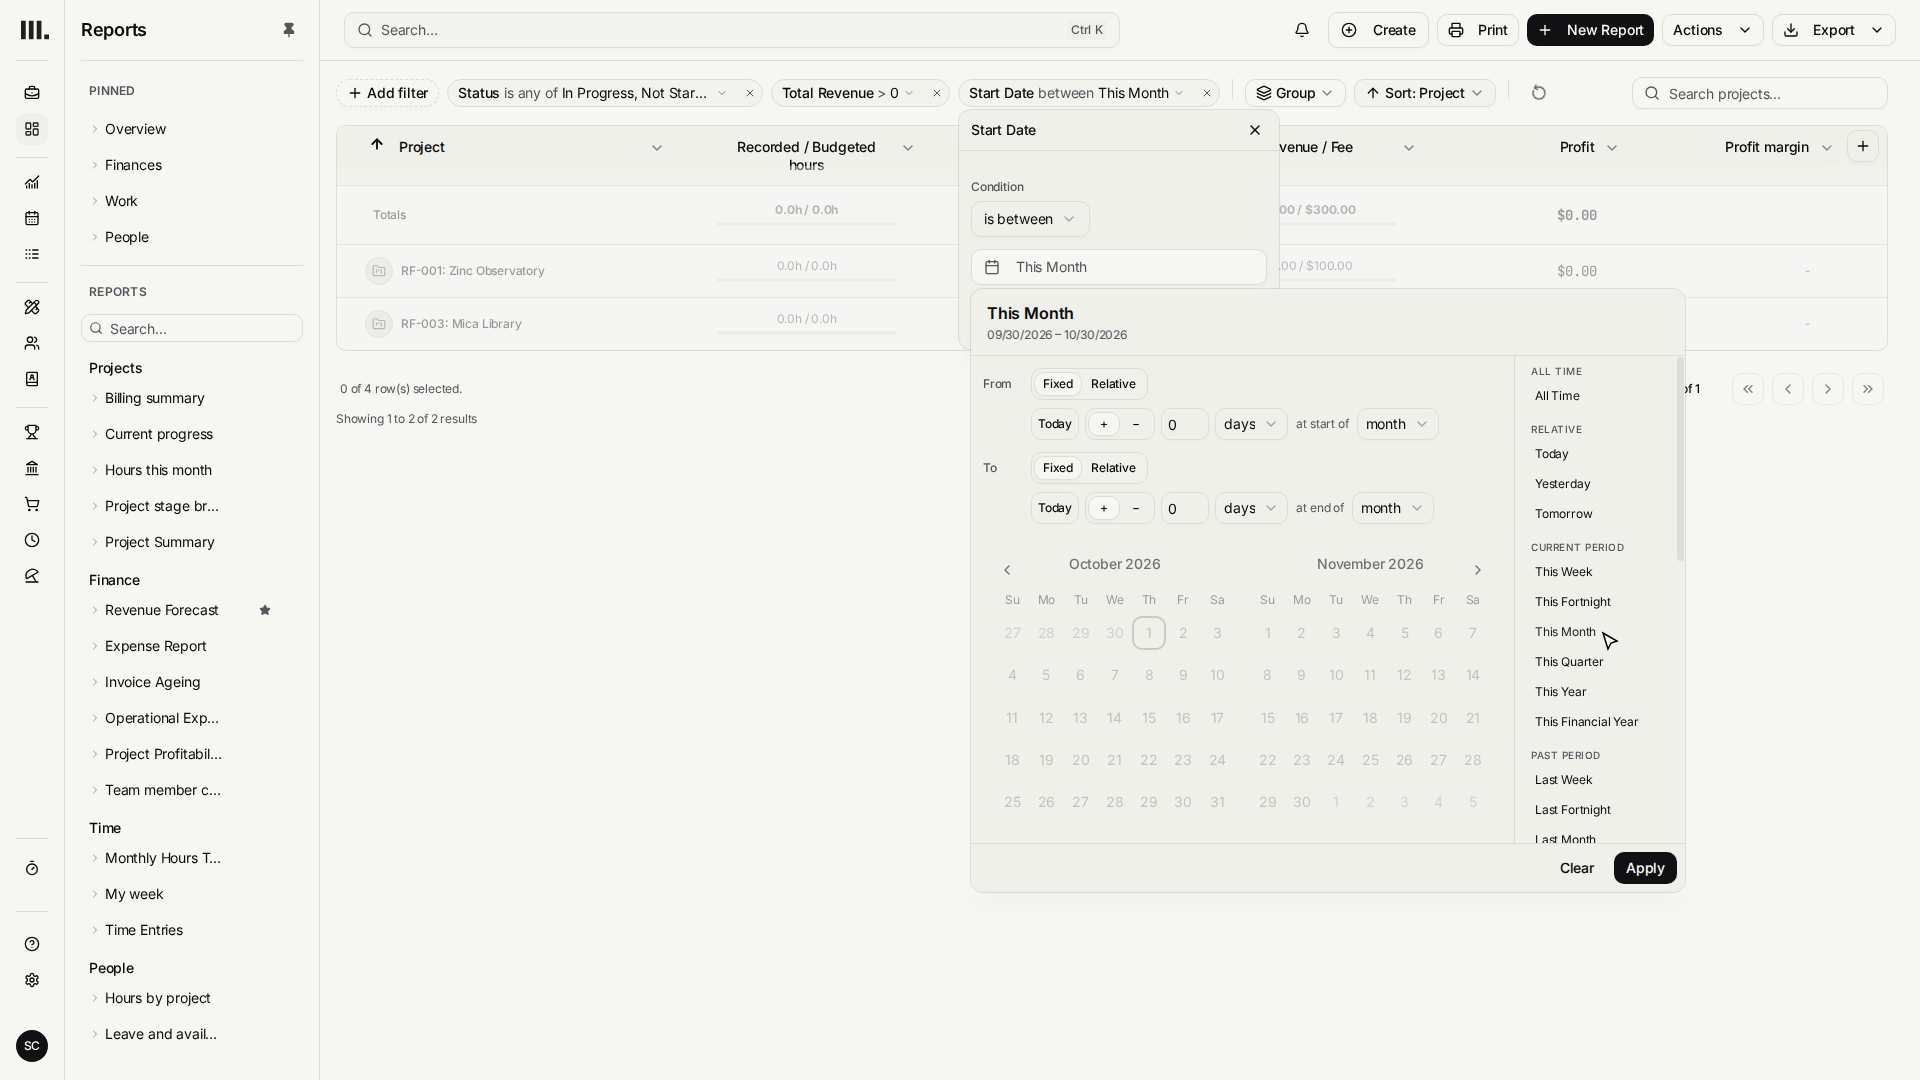
Open the range to see fixed dates, relative bounds, and live presets together, then choose This Month.
- 3
Click Apply. The filter chip now reads This Month instead of two fixed dates.
This Month isn't frozen the day you pick it. Monument resolves a preset like this fresh every time the report runs, so reopening this same report next month shows next month's window automatically, not the calendar page you happened to be on when you filtered it.
Presets and relative bounds keep a filter current on purpose. When a report genuinely needs a window that shouldn't move, an end-of-quarter snapshot compared against a fixed prior period, say, the same control lets you pick or type exact calendar dates instead.
Remove one filter without disturbing the rest
- 1
Remove Total Revenue with the cross on its chip. The filter disappears while Status and Start Date stay exactly as they were.
Filters don't depend on each other. Removing one only removes that one condition, whatever row set the remaining filters already narrowed to stays narrowed the same way.
Every filter you can see, you can change
- 1
Hover the Status chip. Every filter currently shown on a report is a live, editable condition, never a locked scope hiding in the background.
If a report seems to be missing rows you expected, the filter explaining that is always visible as a chip you can open, adjust, or remove, there's no hidden structural filter working against you that the interface doesn't show. And whatever filters are still on the report when you save it save along with it, so the same narrowed view reopens exactly as you left it.
Troubleshooting
- Status won't narrow past one option. An option-list filter matches any ticked value. To narrow further, remove ticks rather than add them, or switch to a different field entirely.
- A numeric filter shows no rows. Check the condition first, greater than versus less than is an easy swap to make by accident, before assuming the underlying data is wrong.
- A date filter looks like it changed on its own. It didn't freeze; that's the point. Presets like This Month and relative bounds like Last 30 Days resolve fresh every time the report runs. Switch that side to a fixed date if you need a window that genuinely shouldn't move.
- A filter you expected to see isn't there to remove. If it's not visible as a chip, it isn't a filter you can edit or clear from this screen; check the entity or route the report is scoped to instead.
Where this fits next
You can now narrow a report to the rows that matter. To change a saved report's columns instead of its rows, see Edit a report. To build a figure none of the ready-made columns already offer, see Formula columns.
Search Monument help
Search help articles and open a result.